

Introduction
In the dynamic world of forex trading, where every decision can make or break a portfolio, understanding moving averages is paramount. Moving averages serve as versatile tools, offering insights into trends, support/resistance levels, and crucial entry/exit points. In this article, we delve into the intricacies of these essential indicators, exploring their types, valuable variations, and techniques that can elevate your forex trading game.
At its core, moving averages are not just analytical tools; they are versatile instruments that serve as the North Star for traders navigating the vast expanse of the forex market. These dynamic indicators transcend mere numerical computations; they are gateways to a deeper comprehension of market trends, support and resistance levels, and the pivotal entry and exit points that define successful trading strategies.
In this article, we embark on a voyage into the heart of these essential indicators, peeling back the layers to reveal the nuanced tapestry that is moving averages in forex trading. It’s an exploration that goes beyond the surface, unraveling the diverse types of moving averages—Simple Moving Averages (SMAs), Exponential Moving Averages (EMAs), and Linear Weighted Moving Averages (LWMAs or WMAs). Each type carries its unique characteristics, weaving a rich narrative that resonates differently with the ebb and flow of the market.
Yet, our exploration doesn’t stop at mere identification. We delve into the significance of these moving averages, with a focus on the 20 EMA, 50 SMA, 100 SMA, and 200 SMA—acknowledged pillars in the forex trading landscape. These are not just numbers; they are keys unlocking doors to short-term trends, medium-term insights, and the grand tapestry of long-term market movements.
However, a subtle caution resonates through our exploration—a reminder that relying solely on these moving averages might offer only a partial view of the intricate forex landscape. To truly elevate one’s trading game, we delve into the art of integration. Successful traders, akin to skilled artists, blend moving averages seamlessly with other indicators, creating a symphony of insights that harmonize to guide strategic decision-making.
As we embark on this exploration, envision it as a treasure hunt where each revelation about moving averages is a precious gem, waiting to be unearthed and polished. The techniques we unravel in this journey are not just strategies; they are tools that can refine and amplify your approach to forex trading.
So, fasten your seatbelts and prepare to navigate the exhilarating twists and turns of the forex market. This article is your compass, guiding you through the labyrinth of moving averages, unveiling their secrets, and empowering you with the knowledge to not just navigate but thrive in the dynamic world of forex trading. Welcome to the realm where understanding moving averages is not just a skill—it’s your gateway to mastering the art of trading.
Understanding Moving Averages
In the vast landscape of forex trading, where precision is paramount, the tapestry of moving averages unfolds with a richness of diversity, each type weaving its unique story of interpretation and insight. Let’s embark on an exploration of these foundational elements—Simple Moving Averages (SMAs), Exponential Moving Averages (EMAs), and Linear Weighted Moving Averages (LWMAs or WMAs)—delving into the nuances that make each a distinct lens through which market trends are revealed.
- Simple Moving Averages (SMAs): At the heart of simplicity lies the Simple Moving Average (SMA). This method adopts a straightforward approach, calculating the average of prices over a specified period. It embodies a historical snapshot, providing a smooth curve that encapsulates the overall performance of a currency pair during the chosen timeframe. Traders often find solace in the simplicity of SMAs, relying on them to discern prevailing trends with clarity.
- Exponential Moving Averages (EMAs): Injecting a dynamic pulse into the analytical landscape, Exponential Moving Averages (EMAs) are designed to be more responsive to recent price changes. By assigning greater weight to the latest data points, EMAs become attuned to rapid market shifts. This responsiveness is particularly valuable in capturing short-term trends and reacting swiftly to emerging market dynamics. EMAs, with their adaptive nature, add a layer of agility to the trader’s toolkit.
- Linear Weighted Moving Averages (LWMAs or WMAs): In the realm of nuance, Linear Weighted Moving Averages (LWMAs or WMAs) take center stage. Unlike their counterparts, LWMAs assign varying weights to different data points, introducing granularity to the analysis. This nuanced perspective allows traders to discern subtle shifts in market dynamics, providing a more detailed understanding of evolving trends. LWMAs are the artisans of interpretation, crafting a narrative that goes beyond averages to reveal the intricate dance of the market.
The choice between these moving averages extends beyond mere preference; it’s a strategic decision that hinges on the intricacies of the currency pair under scrutiny. This choice is further nuanced by the trader’s objective, whether it’s capturing short-term volatility, navigating medium-term trends, or deciphering the grand tapestry of long-term market movements.
As these moving averages become integral to a trader’s toolkit, the strategic decision also extends to the consideration of closing or starting prices. Closing prices, valued for their simplicity, offer a holistic view of overall performance during a specified timeframe. In contrast, starting prices illuminate the market’s immediate reaction to new information, providing a unique vantage point for those seeking to anticipate the initial impact of market catalysts.
This decision, influenced by the intricate dynamics of the currency pair, becomes a delicate dance between simplicity and depth. The astute trader, akin to a conductor orchestrating a symphony, aligns their choice of moving average and pricing point with the nuances of the market. It’s a dance that extracts meaningful insights, informing strategic decisions and ultimately defining success in the ever-evolving world of forex trading.
Valuable Moving Averages
In the intricate tapestry of forex trading, certain moving averages stand out as invaluable guides, illuminating the path through the labyrinth of market fluctuations. Among these guiding lights, the 20 EMA, 50 SMA, 100 SMA, and 200 SMA emerge as pivotal indicators, each casting its luminance on different facets of market trends.
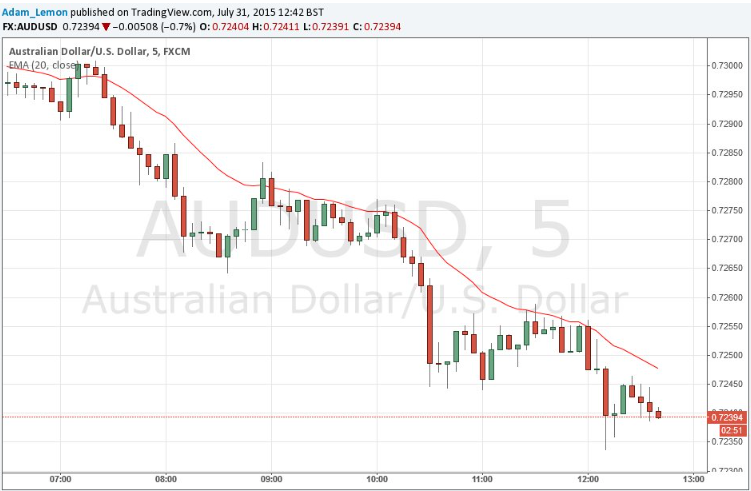
- 20 EMA – The Swift Beacon for Short-Term Trends: The 20 EMA takes center stage, distinguished by its heightened responsiveness to recent price changes. It is the gem of short-term trend identification, swiftly capturing and reflecting the most recent market dynamics. Traders wield the 20 EMA as a beacon, providing timely insights to navigate the ebb and flow of the ever-changing forex landscape.
- 50 SMA and 100 SMA – Reliable Guides for Medium-Term Trends: As we ascend the temporal spectrum, the 50 SMA and 100 SMA come into focus, serving as reliable guides for medium-term trends. These moving averages, with their calculated averages over more extended periods, offer a nuanced understanding of the market’s trajectory. Traders rely on the 50 SMA and 100 SMA for a comprehensive perspective on unfolding trends, allowing them to navigate the complexities with a strategic view.
- 200 SMA – The Formidable Anchor for Long-Term Trends: At the summit of this hierarchy stands the 200 SMA, a formidable tool for identifying long-term trends. Its extended scope provides a panoramic view of the market, enabling traders to discern overarching patterns that may elude shorter-term analyses. The 200 SMA acts as a strategic anchor for those seeking to position themselves in alignment with prolonged market movements, offering a sturdy foundation for long-term strategic decisions.
However, in the nuanced art of forex trading, a note of caution resonates—relying solely on these moving averages may provide only a partial glimpse into the multifaceted nature of the market. Successful traders understand the power of synergy and embark on a holistic approach, combining moving averages with an array of other indicators to construct a more robust analytical framework.
This strategic amalgamation ensures a comprehensive understanding of market dynamics, mitigating the risks associated with a singular reliance on moving averages. It’s akin to weaving a tapestry of insights, where each thread, whether a moving average or another indicator, contributes to the rich and intricate mosaic of information. Astute traders, like skilled artisans, recognize that the true melody of market insights arises from the harmonious interplay of these elements.
In the dynamic and ever-evolving landscape of forex trading, embracing the versatility of moving averages while recognizing their complementarity with other indicators becomes the hallmark of a trader poised for success. It’s a delicate balancing act, a symphony of data points harmonizing to provide a clearer, more nuanced melody of market insights that guides traders towards well-informed decisions in the dynamic forex symphony.
Momentum Indicators Using Moving Averages
Venturing into the realm of Momentum Indicators Using Moving Averages unveils a sophisticated strategy, an artful dance of analysis that transcends traditional market deciphering. This intricate choreography involves the strategic marriage of moving averages with momentum indicators, creating a synergy that elevates a trader’s ability to not only identify trends but also gauge their inherent strengths with heightened precision.
- Momentum Indicators: At the forefront of this strategic collaboration are momentum indicators, illustrious figures such as the Relative Strength Index (RSI) or the Moving Average Convergence Divergence (MACD). These stalwarts emerge as invaluable allies, adding layers of insight to the trader’s analytical arsenal. Their role extends beyond mere data points; they become the maestros orchestrating the symphony of market analysis.
- Examination of Slope: The crux of this collaboration hinges on the examination of the slope of a moving average’s angle—a seemingly subtle yet pivotal element in assessing market momentum. This angle becomes the brushstroke on the canvas of market dynamics, crafting a visual narrative where the trajectory of the moving average’s slope communicates a compelling story of the market’s current state.
- Steep Angle – Robust Momentum: A steep angle in the moving average serves as a visual beacon, signaling a market charged with momentum. It becomes a visual cue that guides traders towards opportunities aligned with the prevailing strong trend. This steep ascent is akin to a crescendo in the market’s symphony, indicating a period of heightened activity and potential opportunities for traders.
- Flat Angle – Weakening Momentum: Conversely, a flat angle in the moving average paints a different picture, suggesting a trend in the process of losing steam. This visual cue serves as an early warning sign, prompting traders to exercise caution and evaluate their positions in light of the market’s evolving dynamics. The gradual descent mirrors a decrescendo in the market’s rhythm, urging traders to navigate with a more discerning eye.
- Concrete Illustration – 20 EMA:
For a tangible illustration, consider the angle of the 20 EMA as a representative example of the market’s momentum. The 20 EMA’s inclination transcends its geometric nature; it transforms into a visual representation of the underlying forces propelling the market. Traders navigating the complexities of forex trading find this visual insight invaluable, enabling them to make informed decisions not just based on historical data but also on the real-time momentum exhibited by the market.
In the grand tapestry of forex trading, the integration of momentum indicators with moving averages is more than an analytical strategy; it’s an art form that transforms market analysis into a fluid and intuitive dance. Each element, from the stalwart momentum indicators to the trajectory of moving averages, contributes to the symphony of market analysis.
As the market’s rhythm evolves, so does the synergy between moving averages and momentum indicators, offering traders a dynamic and responsive toolkit to navigate the ever-shifting currents of the forex landscape. This collaboration is not just an analysis; it’s a harmonious dance, where each step is informed by the interplay of moving averages and momentum indicators, guiding traders towards precision and foresight in the dynamic forex symphony.
Crosses of the Moving Average as Momentum Indicators
The enthralling phenomenon of Crosses of the Moving Average as Momentum Indicators injects a dynamic pulse into the trader’s toolkit, where the intersection of faster and slower averages becomes a canvas painted with potent signals for market entry and exit points.
- Bullish Crossovers: The language of crosses unfolds as a nuanced interplay between short-term and long-term moving averages, a language that traders adeptly decipher to gain insights into momentum shifts within the market. Bullish crossovers, where the short-term moving average gracefully crosses above the long-term, become a call to action. Traders interpret this as a cue to buy, anticipating an upward surge in the market’s momentum.
- Bearish Crossovers: Conversely, bearish crossovers, where the short-term moving average crosses below the long-term, sound the alarm for sellers. This signals a potential downward shift in the market’s momentum, prompting traders to exercise caution and consider strategic exits or even position themselves for short selling opportunities.
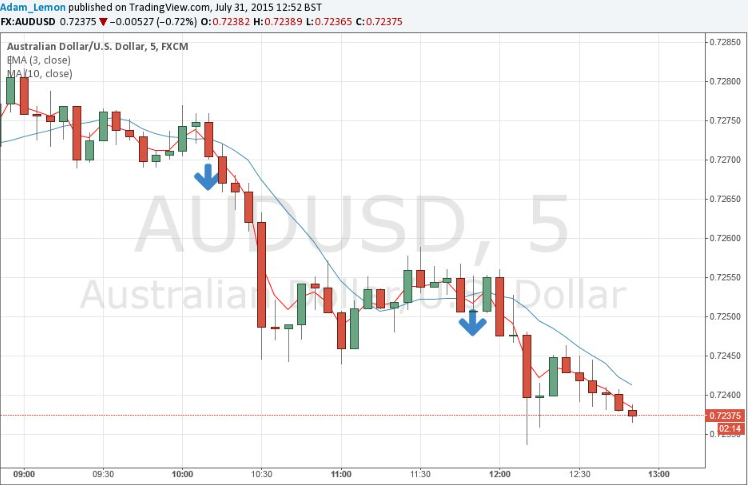
- Real-World Example – 3 EMA and 10 SMA: To bring this theoretical construct to life, envision employing the 3 EMA and 10 SMA on different time scales. When the 3 EMA gracefully crosses above the 10 SMA on a shorter time frame, it unfurls a visual narrative of potential upward movement in the market. This moment becomes a pivotal juncture, a signal for traders to consider positioning themselves for potential gains in anticipation of a bullish trend. Conversely, imagine the scenario where the 3 EMA descends below the 10 SMA on the same shorter time frame. This visual crossing, akin to a red flag, indicates a potential downward shift in the market’s momentum. It becomes a moment where traders, armed with this cross as a cue, may contemplate strategic exits or even position themselves for short selling opportunities in preparation for a bearish trend.
- The Language of Momentum: These crosses, more than mere graphical intersections, represent critical inflection points in the ever-shifting sands of the forex market. They transform the interaction of moving averages into a language of momentum, where each cross becomes a sentence and each sequence a paragraph in the ongoing narrative of market trends.
In the dynamic theater of forex trading, the ability to interpret these crosses is akin to reading the signs along a winding road. Traders skilled in understanding this language gain a heightened ability to navigate the twists and turns of the market landscape. Armed with insights derived from the subtle yet powerful language of moving average crosses, they traverse the market’s narrative with confidence. As the market story unfolds, these crosses become a script, offering valuable cues for making well-informed and strategic trading decisions that align with the unfolding momentum dynamics.
Conclusion
In conclusion, understanding moving averages is fundamental to navigating the complexities of forex trading. Many trend indicators, such as the Bollinger Bands, are based on moving averages, emphasizing their significance in developing successful trading strategies.
The 20 EMA, with its responsiveness, serves as a linchpin in various applications, including trend identification and momentum assessment. However, the true power lies in combining different types of moving averages with other indicators. This synergy creates a more comprehensive analytical toolkit, empowering traders to make well-informed decisions in the ever-evolving forex market.
As you venture into the world of forex trading, remember that understanding moving averages is not a one-size-fits-all solution. It’s about crafting a strategy that aligns with your risk tolerance, investment goals, and the unique characteristics of the currency pairs you’re trading. By mastering the art of moving averages and integrating them intelligently into your approach, you unlock a valuable tool for navigating the dynamic landscape of forex markets.
Click here to read our latest article on The Essential Guide to Leveraging a Trading Journal
FAQs
- What are the different types of moving averages in forex trading? The main types include Simple Moving Averages (SMAs), Exponential Moving Averages (EMAs), and Linear Weighted Moving Averages (LWMAs or WMAs).
- How do momentum indicators enhance trend identification using moving averages? Momentum indicators, such as the Relative Strength Index (RSI) or Moving Average Convergence Divergence (MACD), provide a deeper understanding of market dynamics, amplifying the ability to identify and gauge the strength of trends when combined with moving averages.
- Can you explain the significance of the slope of a moving average in assessing momentum? The slope of a moving average’s angle is crucial; a steep angle indicates a strong trend, while a flat angle suggests a weakening trend. This visual representation of momentum helps traders assess the market’s current state.
- What are the key moving averages used as valuable indicators in forex trading? The 20 EMA, 50 SMA, 100 SMA, and 200 SMA are widely regarded as key indicators. The 20 EMA is valuable for short-term trend identification, while the 50 SMA and 100 SMA provide insights into medium-term trends. The 200 SMA is a powerful tool for identifying long-term trends.
- How do crosses of moving averages serve as momentum indicators for entry and exit points? Crosses, especially between faster and slower moving averages, signal entry and exit points. Bullish crossovers (short-term crossing above long-term) indicate a potential upward movement, while bearish crossovers (short-term crossing below long-term) suggest a possible downward shift.
- Why is it important to not solely rely on moving averages in forex trading? Relying solely on moving averages may offer a partial view of the market. Successful traders often combine moving averages with other indicators to create a more comprehensive and robust analytical framework.
- How can moving averages be applied to identify support and resistance levels? Moving averages can act as dynamic support and resistance levels. Traders observe how prices interact with moving averages, using them as reference points for potential trend reversals or continuations.
- What role do 20 EMA, 50 SMA, 100 SMA, and 200 SMA play in forex trading strategies? The 20 EMA is valuable for short-term trends, the 50 SMA and 100 SMA provide insights into medium-term trends, and the 200 SMA is a powerful tool for identifying long-term trends. Traders often incorporate these moving averages into their strategies based on their time horizon.
- How does the combination of moving averages and other indicators create a robust analytical framework? Combining moving averages with other indicators enhances the overall understanding of market dynamics, mitigating risks associated with a singular reliance on moving averages. It creates a more comprehensive analytical framework, providing a nuanced perspective on the market.
- Can you provide a real-world example of using moving averages for forex trading entry and exit points? Consider using the 3 EMA and 10 SMA on different time scales. When the 3 EMA crosses above the 10 SMA on a shorter time frame, it signals a potential upward movement, while a cross of the 3 EMA below the 10 SMA suggests a possible downward shift. These crosses provide valuable cues for making informed trading decisions.
Click here to read more on Moving Average Strategies for Forex Trading