

Introduction to Trendline Analysis
At the heart of market speculation lies swing trading, a realm where success hinges on the adept use of analytical tools and methodologies. Amidst this toolkit, trendline analysis emerges as a beacon of simplicity with significant implications for trading strategies. Yet, despite its foundational importance, trendline analysis often languishes in the shadows of more intricate indicators. This article endeavors to shed light on the transformative potential of trendline analysis, illuminating its indispensable role in discerning market trends and guiding trade maneuvers.
Understanding Trendline Analysis
Understanding trendline analysis entails the art of delineating market trends by strategically plotting straight lines on a price chart, linking multiple price points to discern the market’s general trajectory. These lines, which connect pivotal highs and lows, serve as graphical depictions of market trends, providing invaluable insights into potential support and resistance levels. The significance of trendline analysis lies in its capacity to furnish traders with an objective framework for evaluating market behavior, empowering them to formulate informed prognostications regarding future price movements.
Embarking on trendline analysis involves selecting key points in the market’s price action. By linking these salient data points—be they the crests of price highs in a downtrend or the troughs of price lows in an uptrend—traders can fashion a trendline mirroring the market’s path. The essence of trendline analysis lies in its simplicity; these lines cut through the cacophony of day-to-day price fluctuations, furnishing a clearer delineation of the market’s overarching trajectory.
Trendlines serve a twofold purpose: not only do they delineate the prevailing trend, but they also function as dynamic levels of support and resistance. In an ascending market, a trendline traced along the lows furnishes a foundation of support, indicating that as long as the price remains above this line, the uptrend remains intact. Conversely, in a descending market, a trendline drawn along the highs serves as a ceiling of resistance, signifying that the downtrend persists as long as the price resides below this threshold.
The objective methodology underpinning the crafting of trendlines sets them apart as a potent tool in the trader’s arsenal. Unlike many other technical indicators reliant on intricate computations, trendlines proffer a straightforward, visual approach to comprehending market dynamics. They necessitate traders to identify merely two or more pivotal points to delineate a line that can illuminate potential future price action.
Furthermore, the import of trendline analysis transcends mere trend identification. It furnishes a framework for making astute forecasts regarding future price movements. For instance, a breach of a trendline might signal a potential market reversal, affording traders early indications of substantial shifts in market sentiment. This prescient capability to anticipate changes renders trendline analysis an indispensable facet of any trading strategy, aiding in decision-making processes by offering insights into opportune moments for trade entry or exit.
In summation, grasping trendline analysis revolves around acknowledging its pivotal role as a foundational instrument in a trader’s repertoire. It embodies the principle that through simplicity, one can unearth profound insights into market behavior. By connecting crucial highs and lows to draw trendlines, traders unlock a mechanism for navigating the intricacies of the market, armed with a clearer perspective on potential support and resistance levels and the overall trajectory of market trends.
The Role of Trendlines in Identifying Market Behavior
Trendlines serve as vital tools in unraveling the intricate dynamics of market behavior, offering traders invaluable insights into potential areas of support and resistance. These lines act as guides, providing strategic entry and exit points by pinpointing zones where price movements may stall or reverse.
Functioning akin to navigational beacons, trendlines demarcate significant levels where price action tends to exhibit notable reactions. Whether it’s a bounce off a support trendline or a reversal at a resistance trendline, traders can leverage these insights to make informed trading decisions.
Furthermore, the slope of a trendline offers valuable clues about the prevailing market sentiment. An upward-sloping trendline reflects bullish momentum, indicating a market characterized by optimism and upward momentum. Conversely, a downward-sloping trendline suggests bearish sentiment, signaling caution and a potential downturn in prices.
In essence, trendlines are more than just lines on a chart; they are indispensable tools that empower traders to navigate the complexities of the market with confidence and foresight. By understanding and interpreting the signals provided by trendlines, traders can navigate market fluctuations with precision, seizing opportunities and managing risks effectively.
Incorporating Trendline Analysis into Trading Strategies
Integrating trendline analysis into trading strategies enhances the ability to identify optimal entry and exit points within trending markets. A crucial element of this analysis involves recognizing trendline breaks, which often signify potential shifts in market direction. These breaks serve as key indicators for initiating or closing positions, depending on whether the trendline acts as support or resistance.
By incorporating trendline analysis into trading methodologies, traders gain a competitive edge in navigating market complexities. Identifying and interpreting trendline breaks empowers traders to make informed decisions, capitalizing on emerging opportunities and managing risks effectively.
Moreover, trendline analysis provides traders with insights into market sentiment and directionality, enabling them to adapt their strategies accordingly. Whether pinpointing trendline support levels for strategic entries or identifying trendline resistance levels for timely exits, the integration of trendline analysis enhances the precision and effectiveness of trading strategies.
In essence, integrating trendline analysis into trading strategies is fundamental for trading success, offering traders a systematic approach to navigating market trends and seizing profitable trading opportunities. By mastering trendline analysis, traders can refine their strategies and achieve consistent results in the dynamic world of financial markets.
Drawing Trendlines: Art or Science?
Drawing trendlines requires a blend of objective criteria and subjective interpretation, blurring the lines between art and science. While grounded in objective principles, such as connecting key highs and lows, trendline analysis also involves a degree of subjectivity in its execution.
The validity of a trendline is reinforced by the number of touchpoints it establishes with price movements. More touchpoints generally signify a stronger trendline, enhancing its reliability in identifying support and resistance levels within the market.
However, traders must exercise discretion in selecting the precise points to connect, adding an artistic dimension to trendline analysis. This subjective element underscores the importance of traders’ judgment and experience in accurately interpreting market movements.
Ultimately, mastering trendline analysis entails striking a balance between objective criteria and subjective interpretation, leveraging both the art and science of drawing trendlines to inform effective trading strategies.
Best Practices in Trendline Trading
Incorporating best practices in trendline trading is paramount for traders to navigate market fluctuations adeptly. Understanding trendline breaks and their effects on market behavior is pivotal for successful trading strategies.
A robust trendline, validated by at least three touchpoints, lays a solid groundwork for analysis, providing clear support and resistance levels. However, it’s imperative for traders to delve deeper and assess the context surrounding a trendline break.
Considerations such as the timeframe of the break and subsequent price actions are essential in discerning genuine market reversals from false breakouts. This comprehensive analysis empowers traders to make well-informed decisions and seize profitable trading opportunities effectively.
By adhering to these best practices in trendline trading, traders can develop a systematic approach, enhancing their ability to navigate market volatility and achieve consistent success in their trading endeavors.
Practical Applications and Examples
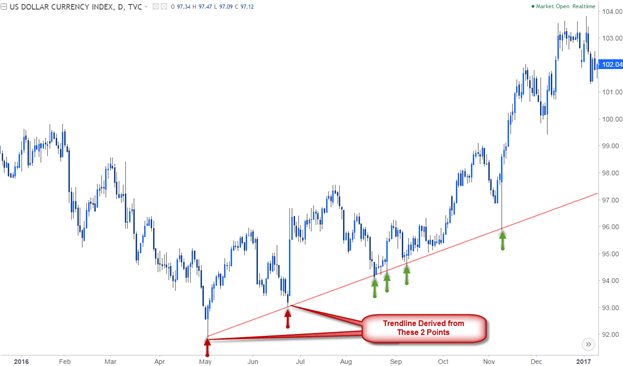
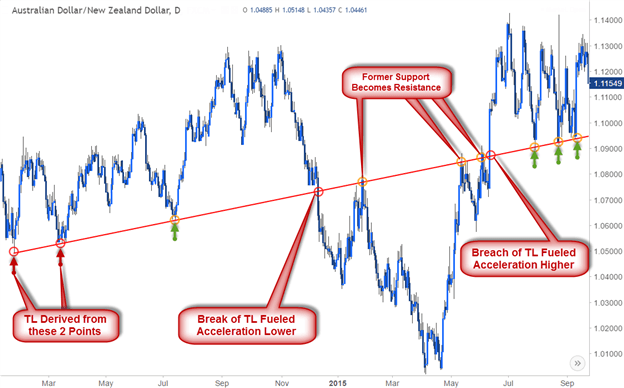
In practical trading applications, trendline analysis plays a pivotal role in decoding real-world market dynamics. Take, for example, the U.S. Dollar Index/NZD market, where a single trendline acts as both support and resistance, showcasing the versatility of trendlines in market interpretation.
source:dfx
In the U.S. Dollar Index scenario, a positive slope on the trendline signifies a bullish market outlook. Traders strategically buy on retracements towards trendline support, leveraging the market’s tendency to bounce off these levels for favorable entry points during uptrends.
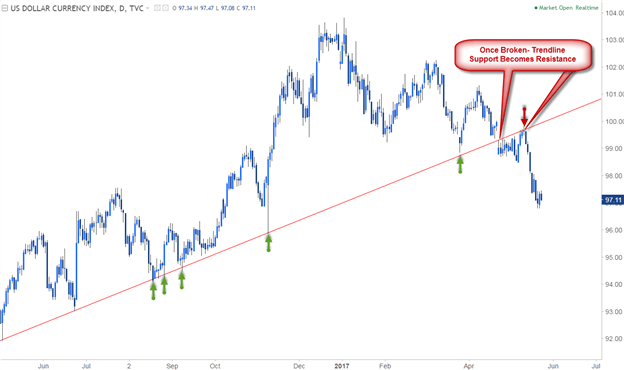
Conversely, in the AUD/NZD chart, a breached trendline transforms into a formidable resistance barrier. This delineation of clear resistance points post-break highlights the predictive power of trendlines. Moreover, these resistance levels can transition into support zones upon a trend reversal, exemplifying the dynamic nature of trendline analysis in guiding traders’ decisions amidst market shifts.
source:dfx
Advanced Trendline Analysis Techniques
In the realm of trendline analysis, advanced techniques elevate traders’ predictive accuracy by integrating multi-timeframe scrutiny. Moving beyond basic applications, this approach optimizes timing and positioning by aligning short-term entry points with long-term market directions. The forthcoming discussion on Pitchfork and median-line analysis introduces tools for pinpointing precise support and resistance zones within trends, offering a sneak peek into more sophisticated strategies.
By integrating multi-timeframe analysis with trendline strategies, traders gain comprehensive insights into market dynamics. This strategic approach allows for nuanced decision-making based on the confluence of trends, maximizing trading opportunities across various time horizons.
Conclusion
Trendline analysis emerges as a fundamental aspect of technical trading, providing a simple yet impactful tool for navigating market intricacies. Its capacity to pinpoint support and resistance levels offers a structured approach to comprehending market dynamics, steering traders towards informed decisions. From basic trade setups to advanced analytical methods, the versatility and enduring relevance of trendlines are evident.
Integrating trendline analysis into a comprehensive trading strategy amplifies the capability to interpret market signals, leading to strategic entry and exit points. In the journey of traders, continual learning and adaptation are paramount, with trendlines serving as a foundational pillar for constructing a robust trading methodology.
Click here to read our latest article on Anti – Aging Impact
Next Steps
Looking forward, the series will explore advanced techniques such as Pitchfork and median-line analysis, which amplify our ability to navigate market trends. Building on the foundational principles of trendline analysis, these methods offer deeper insights into market dynamics and potential trade setups. By integrating these advanced tools into their arsenal, traders can elevate their analytical prowess, embracing a holistic approach to market analysis.
As we wrap up this introduction to trendline analysis, I urge practitioners to actively implement these concepts in their trading endeavors. Through experimentation and consistent practice, traders can master the art of trendline drawing and interpretation, paving the way for more sophisticated analyses and potentially lucrative trading strategies.
FAQs
- What constitutes trendline analysis, and why is it pivotal in trading? Trendline analysis involves delineating lines on a price chart to discern trends and potential entry/exit points. It’s pivotal in trading as it empowers traders to anticipate market movements and execute informed decisions.
- How can one accurately draw trendlines? To draw trendlines accurately, connect a minimum of three significant highs or lows on a price chart. This establishes a trendline, furnishing insights into the market’s directional bias.
- What function do trendlines serve in pinpointing support and resistance levels? Trendlines aid in identifying support (price floors) and resistance (price ceilings) levels, enabling traders to forecast potential price reversals or pauses, thereby facilitating strategic trading opportunities.
- Is trendline analysis prone to subjectivity? Yes, to some extent, trendline analysis can be subjective. While there are objective criteria for drawing trendlines, traders may interpret them differently based on their discretion and individual trading methodologies.
- How do trendline breaks influence trading strategies? Trendline breaks denote potential shifts in market direction. Traders often utilize these breaks as signals to enter or exit trades, contingent upon whether the trendline serves as support or resistance.
- What are the optimal strategies for trendline trading? Optimal strategies for trendline trading encompass validating trendlines with multiple touchpoints, evaluating breaks within specific timeframes, and exercising patience by awaiting pullbacks for favorable entries.
- In what ways can traders employ trendlines in multi-timeframe analysis? Traders can integrate trendlines into multi-timeframe analysis to synchronize short-term entry opportunities with long-term market trends. This approach optimizes trade timing and positioning.
- What are some prevalent errors to avoid in trendline analysis? Common errors in trendline analysis include drawing trendlines with inadequate touchpoints, disregarding the context surrounding trendline breaks, and solely relying on trendlines without considering additional market factors.
- How can traders hone their trendline analysis proficiency? Traders can refine their trendline analysis skills through consistent practice, experimentation, and studying historical price charts. Seeking guidance from seasoned traders can also offer valuable insights for skill enhancement.
- Why is trendline analysis instrumental in crafting a comprehensive trading strategy? Trendline analysis serves as the cornerstone of a comprehensive trading strategy, providing a structured framework for identifying market trends and executing well-informed trading decisions. Integrating trendline analysis with other technical indicators and risk management techniques augments the overall efficacy of a trading approach.