

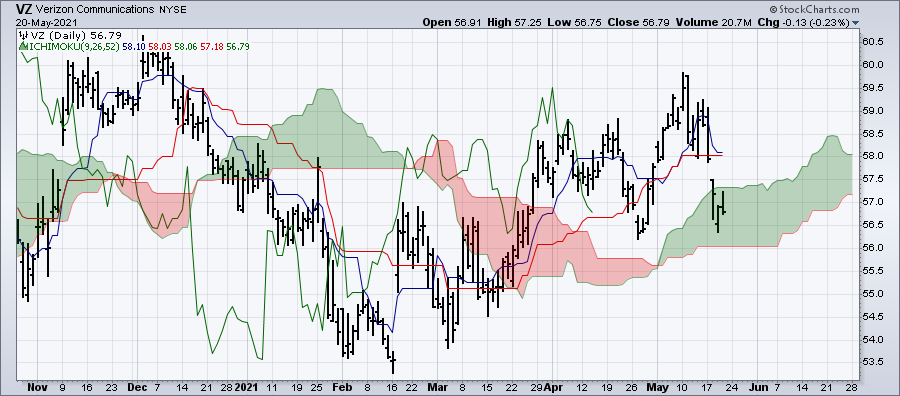
Introduction to the Ichimoku Cloud
The Ichimoku Cloud Indicator is not merely another technical tool in the world of forex trading; it stands as a formidable ally for traders venturing into the intricate realm of the foreign exchange market. Whether you find yourself on the seasoned path of a veteran trader or are at the initial stages of your forex journey, grasping the essence of the Ichimoku Cloud Indicator has the potential to revolutionize your approach.
In this all-encompassing guide, our aim is to unravel the mystique surrounding the Ichimoku Cloud. We will embark on a journey to dissect its intricate components, demystify its inner workings, and equip you with a diverse array of strategies that hold the promise of catapulting your forex trading endeavors to new heights.
The foreign exchange market can often appear as an enigmatic sea of currencies in constant flux, and navigating it demands more than just a rudimentary understanding of charts and numbers. It necessitates a profound insight, an analytical edge, and an ally that can offer clarity amidst the chaos. The Ichimoku Cloud Indicator is precisely that ally, poised to illuminate your trading path, irrespective of whether you’re a novice or a seasoned trader.
As we embark on this comprehensive journey, envision the Ichimoku Cloud Indicator as your guiding star through the turbulent waters of forex trading. It’s a tool that can help you decipher market trends, identify critical entry and exit points, and ultimately, steer your trading vessel toward the shores of success. So, fasten your seatbelts, for this guide is your passport to unlocking the full potential of the Ichimoku Cloud Indicator in the world of forex trading.
Understanding the Ichimoku Cloud Indicator
Ichimoku Kinko Hyo: The Japanese Art of Charting
In our quest to unravel the complexities of the Ichimoku Cloud Indicator, we embark on a journey that pays homage to its Japanese roots. “Ichimoku Kinko Hyo,” a term rich in historical and cultural significance, beautifully encapsulates the essence of this remarkable indicator. Translated as the “one glance equilibrium chart,” these words offer profound insights into the core philosophy behind the Ichimoku Cloud.
In the world of forex trading, where time is often of the essence and decisions must be made swiftly, the notion of achieving an equilibrium in a single glance holds tremendous appeal. This concept aligns with the fundamental principle of efficiency, a value deeply ingrained in Japanese culture. It reflects the Japanese approach to problem-solving, which prioritizes simplicity, clarity, and effectiveness.
The very essence of “Ichimoku Kinko Hyo” lies in its ability to provide traders with a panoramic view of the market dynamics in an instant. It’s akin to a seasoned sailor glancing at the horizon to gauge the weather conditions and chart a course. In the world of forex trading, where every tick of the clock can impact trading decisions, having a tool that offers a comprehensive snapshot of the market is invaluable.
Picture yourself standing at the helm of a ship, peering out into the vast expanse of the sea. The Ichimoku Cloud Indicator is your navigational instrument, guiding you through the choppy waters of the foreign exchange market. With a single glance, you can assess the prevailing winds, the tides of market sentiment, and the potential hazards that lie ahead.
As we delve deeper into the intricacies of the Ichimoku Cloud Indicator, remember its Japanese heritage and the artistry with which it provides traders with a holistic perspective. It’s not just a technical tool; it’s a testament to the Japanese ethos of achieving equilibrium and clarity through simplicity—a philosophy that has found a profound application in the world of forex trading.
The Ichimoku Cloud Indicator is a technical analysis tool that incorporates multiple components to assess key aspects of a currency pair’s price movement. These components include:
Tenkan Sen (Conversion Line)
Within the intricate framework of the Ichimoku Cloud Indicator lies the Tenkan Sen, a vital component often affectionately referred to as the “Conversion Line.” To comprehend the significance of the Tenkan Sen, we must first unravel its purpose and function.
Imagine the Tenkan Sen as the pulse of the market—a dynamic indicator that reflects short-term momentum and acts as a guiding signal line for traders navigating the forex terrain. Its calculation is elegantly straightforward: it represents the midpoint between the highest high and the lowest low over a specific time period, typically nine periods.
Now, let’s dive into the essence of the Tenkan Sen’s role. Picture it as a watchful sentinel, observing the intricate dance of currency prices in the short term. Like a seismograph recording tremors in the earth, the Tenkan Sen captures the fluctuations in currency pair prices. It responds swiftly to changes, allowing traders to gauge the immediate mood of the market.
One of the Tenkan Sen’s most notable functions is its ability to generate signals—a skill highly sought after in the world of forex trading. When this Conversion Line crosses above the Kijun Sen (Base Line), it heralds a moment of significance. This crossover event is akin to a green light for traders, indicating a potential bullish trend and suggesting that it might be an opportune time to consider buying positions.
This signal isn’t a mere coincidence; it’s rooted in the Ichimoku Cloud’s intricate logic. When the Conversion Line rises above the Base Line, it signifies that short-term momentum is on the rise, potentially aligning with a broader bullish sentiment. Traders interpret this as a promising buying opportunity, as it implies that the recent price action is favorable.
In essence, the Tenkan Sen acts as a compass needle, pointing traders in the direction of potential opportunities in the tumultuous sea of forex trading. Its responsiveness to short-term market dynamics and its capacity to generate signals make it an invaluable tool in the Ichimoku Cloud Indicator’s repertoire.
As you journey deeper into the world of forex trading and the Ichimoku Cloud, remember the Tenkan Sen as your ally in deciphering short-term market momentum. Its ability to provide timely signals can aid you in making well-informed trading decisions, and its role as the “Conversion Line” is a testament to its power to convert market insights into profitable actions.
Kijun Sen (Base Line)
In the intricate tapestry of the Ichimoku Cloud Indicator, the Kijun Sen assumes the role of the “Base Line,” a component that plays a pivotal part in understanding market dynamics. To truly appreciate the significance of the Kijun Sen, we must delve into its calculation, purpose, and the signals it offers to forex traders.
The Kijun Sen, or Base Line, mirrors the essence of the Tenkan Sen (Conversion Line) but operates on a slightly longer time frame. It is calculated similarly, considering the midpoint between the highest high and the lowest low, but extends its gaze over a span of twenty-six periods. This extended timeframe provides traders with a medium-term perspective of price movement—an invaluable tool for those navigating the complexities of the forex market.
Imagine the Kijun Sen as a steady hand guiding you through the ups and downs of the forex landscape. While the Tenkan Sen focuses on short-term momentum, the Base Line casts its gaze further ahead, seeking to capture the essence of medium-term price dynamics. It doesn’t react as swiftly as its counterpart but instead offers a broader perspective, akin to looking at a larger canvas to grasp the bigger picture.
One of the most compelling features of the Kijun Sen is its ability to generate signals that can guide trading decisions. Similar to the Tenkan Sen, a significant event occurs when the Conversion Line crosses above or below the Base Line.
A bullish signal emerges when the Tenkan Sen crosses above the Kijun Sen. This occurrence signifies a moment of potential opportunity, suggesting that short-term momentum, as indicated by the Conversion Line, is aligned with a medium-term perspective, creating a favorable environment for buying positions.
Conversely, a bearish signal manifests when the Tenkan Sen crosses below the Kijun Sen. This event serves as a cautionary note for traders, implying that the short-term momentum is at odds with the medium-term view, potentially signaling a market shift that favors selling positions.
In essence, the Kijun Sen, or Base Line, is your strategic guidepost in the world of forex trading. It offers a medium-term perspective that complements the short-term insights of the Tenkan Sen, providing a holistic view of market sentiment. As you continue your journey into the realm of the Ichimoku Cloud Indicator, remember the Kijun Sen as your steady companion, offering guidance in the ever-evolving landscape of forex trading.
Senkou Span A (Leading Span A)
In the intricate realm of the Ichimoku Cloud Indicator, the Senkou Span A, also known as the “Leading Span A,” emerges as a pivotal component that holds the power to shape traders’ perspectives and decisions. To grasp the significance of Senkou Span A, we must embark on a journey to unravel its calculation, purpose, and its role in creating the iconic “cloud” or “kumo.”
Senkou Span A is a representation of the future—a visionary aspect of the Ichimoku Cloud that seeks to illuminate the path ahead. Its calculation is elegantly simple yet profound in its implications. It is derived by taking the average of two essential components of the Ichimoku Cloud: the Tenkan Sen (Conversion Line) and the Kijun Sen (Base Line). This calculated value is then projected forward in time, creating a dynamic “cloud” or “kumo” that extends into the future.
Picture the Senkou Span A as a beacon that casts its light into the unknown, shedding illumination on what lies ahead in the forex market. It symbolizes the midpoint between the Conversion Line and the Base Line, effectively capturing the equilibrium between short-term and medium-term market sentiments. This equilibrium is then projected forward, allowing traders to glimpse into the potential future dynamics of currency pairs.
The true magic of Senkou Span A becomes apparent when it combines forces with its counterpart, Senkou Span B (Leading Span B). The area between these two spans is shaded, creating the iconic cloud formation that has come to be associated with the Ichimoku Cloud Indicator. This cloud serves as a visual representation of future potential support and resistance levels—an invaluable tool for traders seeking to anticipate price movements.
Imagine the cloud as a sanctuary for traders, offering insight into the battles between buyers and sellers that will unfold in the days and weeks to come. When price action ventures into this cloud, it’s akin to stepping into uncharted territory, and the cloud’s upper and lower boundaries may act as barriers or stepping stones.
In essence, Senkou Span A is the visionary element of the Ichimoku Cloud, projecting the equilibrium between short-term and medium-term market sentiment into the future. It creates a visual landscape that traders can navigate, offering insights into potential support and resistance levels. As you delve deeper into the world of the Ichimoku Cloud Indicator, remember the Leading Span A as your guide to peering into the future of forex trading.
Senkou Span B (Leading Span B)
Within the intricate framework of the Ichimoku Cloud Indicator, the Senkou Span B, affectionately referred to as the “Leading Span B,” assumes a pivotal role in guiding traders through the complexities of the forex market. To truly appreciate its significance, we must delve into its calculation, purpose, and its role as a confirmatory element within the Ichimoku Cloud.
The Senkou Span B is akin to the anchor of a ship—a steadfast component that provides confirmation of the overall trend direction. Its calculation is derived from a slightly different perspective, one that extends over a more extended timeframe. To calculate Senkou Span B, we consider the average of the highest high and the lowest low over a specific period, similar to the approach taken for the Tenkan Sen and Kijun Sen. Like its counterparts, this value is projected forward in time, providing a glimpse into the future landscape of the forex market.
Imagine Senkou Span B as a guardian, stationed at the gates of a fortress, ensuring that only those aligned with the broader trend can pass through. Its calculation over a more extended period allows it to offer a perspective that extends beyond the immediacy of short-term fluctuations. Instead, it evaluates the overarching trend direction, acting as a sentinel for traders seeking confirmation.
One of the most compelling aspects of Senkou Span B is its role in providing traders with clarity regarding the overall market sentiment. When Senkou Span A (Leading Span A) is positioned above Senkou Span B (Leading Span B), it sends a resounding signal—an indicator of a bullish trend. In this scenario, the equilibrium between short-term and medium-term sentiment leans favorably towards the bulls, suggesting that the market may be inclined to rise.
Conversely, when Senkou Span A finds itself below Senkou Span B, it unfurls the bearish standard. This alignment implies that short-term sentiment is at odds with the medium-term perspective, signaling a potential shift in the market’s favor for bears.
In essence, Senkou Span B is your ally in confirming the broader trend direction within the Ichimoku Cloud Indicator. It evaluates market dynamics over an extended timeframe, offering clarity and guidance to traders. As you continue your voyage through the world of forex trading and the Ichimoku Cloud, keep Senkou Span B in mind as the steadfast guardian that confirms the prevailing winds of market sentiment.
Chikou Span (Lagging Span)
In the intricate landscape of the Ichimoku Cloud Indicator, the Chikou Span, affectionately known as the “Lagging Span,” emerges as a unique component that offers traders a glimpse into the recent past. To fully appreciate its significance, we must embark on a journey to unravel its calculation, purpose, and its role in evaluating the strength of support and resistance levels.
The Chikou Span serves as a time traveler, journeying back in time to provide traders with a reflection of the current closing price. Its calculation is elegantly simple yet carries profound implications. It essentially takes the most recent closing price and shifts it backward along the time axis. This backward shift creates a visual representation of where the current closing price stood in the recent past.
Imagine the Chikou Span as a historian, meticulously documenting the recent past of price action in the forex market. Like an archivist preserving historical records, it diligently assesses the strength of support and resistance levels that have played a role in shaping recent market dynamics.
One of the most compelling aspects of the Chikou Span is its role as an indicator of trend strength. When the Chikou Span is positioned above the price curve, it sends a resounding signal—a bullish proclamation. This alignment suggests that the recent closing price is above its historical counterpart, indicating a bullish trend. In this scenario, the market’s recent past aligns favorably with an upward trajectory.
Conversely, when the Chikou Span finds itself below the price curve, it unfurls the bearish standard. This configuration implies that the recent closing price is below its historical counterpart, signaling a bearish trend. It suggests that the recent market sentiment is in line with a downward trajectory.
In essence, the Chikou Span is your temporal guide within the Ichimoku Cloud Indicator, offering insights into the recent past and the strength of support and resistance levels. As you navigate the dynamic world of forex trading, consider the Lagging Span as your historian, providing valuable context to recent market dynamics and helping you make informed trading decisions.
Trading with Ichimoku Cloud
Having explored the fundamental components of the Ichimoku Cloud Indicator, it’s time to embark on a practical journey of putting this powerful tool to work in your forex trading strategies. With a solid understanding of its various elements—Tenkan Sen, Kijun Sen, Senkou Span A, Senkou Span B, and Chikou Span—you’re equipped to harness the potential of this indicator for informed trading decisions.
Here’s how to integrate the Ichimoku Cloud into your forex trading strategy:
- Identify Trend Direction: Start by assessing the alignment of Senkou Span A and Senkou Span B. A bullish trend is indicated when Senkou Span A is above Senkou Span B, and a bearish trend is suggested when the reverse occurs. This initial evaluation helps you set the tone for your trading strategy.
- Confirm Entry Points: Utilize the Tenkan Sen and Kijun Sen crossovers to confirm entry points. A bullish signal arises when the Tenkan Sen crosses above the Kijun Sen, while a bearish signal occurs in the opposite scenario. These crossovers provide valuable insights into short-term momentum.
- Consider Support and Resistance: The Senkou Spans and the Chikou Span offer critical support and resistance levels. When price action approaches the cloud, these levels can act as barriers or stepping stones. Use them to make informed decisions on setting stop-loss and take-profit orders.
- Evaluate Trend Strength: The Chikou Span’s position relative to the price curve provides insight into trend strength. An above-curve Chikou Span indicates bullish strength, while a below-curve Chikou Span suggests bearish momentum.
- Practice Risk Management: As with any trading strategy, risk management is pivotal. Implement stop-loss orders and manage position sizes carefully to protect your capital.
- Backtest and Practice: Before committing real capital, consider backtesting your strategy on historical data. Additionally, practice on a demo account to refine your skills and gain confidence in using the Ichimoku Cloud.
- Stay Informed: Keep an eye on broader market fundamentals, economic events, and news that may impact your chosen currency pairs. Combining fundamental analysis with the Ichimoku Cloud can enhance your trading decisions.
Remember that while the Ichimoku Cloud Indicator is a powerful ally, it’s not infallible. It’s essential to use it in conjunction with other tools and indicators, practice discipline, and continuously refine your strategy based on changing market conditions.
As you begin your journey of trading with the Ichimoku Cloud, consider it as your trusted companion, providing insights, guidance, and a holistic view of the forex market. With practice and experience, you can elevate your trading success and navigate the intricate waters of forex trading with confidence.
Basic Strategies for Trading with Ichimoku Cloud
As you embark on your journey to master the Ichimoku Cloud Indicator, it’s essential to familiarize yourself with some basic yet highly effective trading strategies that can enhance your forex trading success. These strategies harness the power of the Ichimoku Cloud’s components, offering valuable insights into market trends and potential entry and exit points. Let’s delve into two fundamental strategies:
Kumo Breakout Strategy:
The Kumo Breakout strategy is one of the most frequently employed techniques by traders utilizing the Ichimoku Cloud. It centers on identifying breakout points from the Kumo, or cloud, which is a key element of the indicator.
Here’s how the Kumo Breakout strategy works:
- Bullish Breakout: When the price breaks above the cloud (Kumo), it often signals the emergence of a bullish trend. This breakout suggests that the market sentiment is shifting in favor of the bulls. Traders may interpret this as an opportunity to enter long positions or to add to existing ones.
- Bearish Breakout: Conversely, when the price breaks below the cloud (Kumo), it may indicate a bearish trend in the making. This breakout suggests that market sentiment is leaning toward the bears. Traders can consider this as a signal to enter short positions or to manage existing ones with a bearish bias.
The Kumo Breakout strategy relies on the cloud’s ability to act as a significant support or resistance level. When price breaches this critical zone, it often implies a shift in the balance of power within the market.
Tenkan-Kijun Crossover Strategy:
The Tenkan-Kijun Crossover strategy is another cornerstone of Ichimoku Cloud trading. It revolves around the interaction between the Tenkan Sen and the Kijun Sen, providing clear signals for traders.
Here’s how the Tenkan-Kijun Crossover strategy operates:
- Bullish Signal: When the Tenkan Sen crosses above the Kijun Sen, it generates a bullish signal. This crossover indicates that short-term momentum is on the rise and suggests a potential buying opportunity. Traders often use this signal to enter long positions or to confirm existing bullish sentiments.
- Bearish Signal: Conversely, when the Tenkan Sen crosses below the Kijun Sen, it signifies a bearish trend. This crossover implies that short-term momentum is waning, and traders may interpret it as an opportunity to enter short positions or to manage existing positions with a bearish bias.
The Tenkan-Kijun Crossover strategy relies on the principle that short-term trends can offer valuable insights into market sentiment. This crossover serves as a simple yet effective tool for identifying potential entry and exit points.
While these basic strategies provide a solid foundation for trading with the Ichimoku Cloud, it’s crucial to remember that no strategy is foolproof. It’s essential to conduct thorough analysis, practice risk management, and adapt your approach to changing market conditions. With dedication and experience, these strategies can become valuable tools in your forex trading arsenal, elevating your potential for success in the dynamic world of currency trading.
Advanced Strategies for Trading with Ichimoku Cloud
As you delve deeper into the realm of the Ichimoku Cloud Indicator, you’ll encounter advanced strategies that provide even greater depth and precision to your forex trading endeavors. These strategies leverage the subtleties of the Ichimoku components to detect nuanced market conditions and enhance your decision-making process. Here are two advanced strategies that can elevate your trading success:
Kumo Twist Strategy
The Kumo Twist strategy is an advanced technique that involves keenly observing changes in the cloud’s shape, specifically focusing on twists or turns within the cloud. This strategy is predicated on the idea that a twist in the cloud can signal a potential trend reversal or a significant shift in market sentiment.
Here’s how the Kumo Twist strategy operates:
- Twist as a Reversal Signal: When you identify a twist in the cloud, it suggests a potential trend reversal. For example, if the cloud previously exhibited a bearish bias but undergoes a twist, it may indicate a shift towards a bullish trend. Conversely, a twist in a previously bullish cloud can signal a potential bearish reversal.
- Confirming the Twist: To strengthen the validity of the twist as a signal, traders often look for confluence with other indicators or factors, such as support and resistance levels, volume analysis, or fundamental developments.
The Kumo Twist strategy requires a keen eye and an understanding of the Ichimoku Cloud’s subtleties. It’s a strategy that can provide early indications of significant market shifts, but it also demands a careful approach and confirmation before making trading decisions.
Senkou Span Confluence Strategy
The Senkou Span Confluence strategy is an advanced technique that centers on the interaction between Senkou Span A and Senkou Span B, specifically when these two components are in close proximity to each other. This proximity creates a zone of confluence that can act as robust support or resistance levels.
Here’s how the Senkou Span Confluence strategy functions:
- Identifying Confluence Zones: Traders closely monitor the relationship between Senkou Span A and Senkou Span B within the cloud. When these two spans are in close proximity, it creates a confluence zone. This zone can act as a potent support level if the price approaches from below or a formidable resistance level if approached from above.
- Trading Opportunities: When price action interacts with a Senkou Span confluence area, traders seek opportunities that align with their overall trading strategy. For example, a bounce off a confluence zone may prompt a bullish trade, while a rejection from above may signal a bearish opportunity.
The Senkou Span Confluence strategy provides traders with a unique perspective on support and resistance levels, offering additional confirmation for trading decisions. It’s an advanced approach that requires a comprehensive understanding of the Ichimoku Cloud and its components.
As you explore these advanced strategies, remember that they should complement your overall trading plan and risk management strategy. While they offer valuable insights, they are not standalone solutions. Successful trading requires a holistic approach, combining technical analysis, fundamental analysis, and disciplined execution. With experience and a deep understanding of the Ichimoku Cloud, these advanced strategies can become powerful tools in your forex trading arsenal, guiding you to more informed and precise trading decisions.
Ichimoku Cloud in Risk Management
Effective risk management is the cornerstone of profitable forex trading, and the Ichimoku Cloud Indicator offers valuable tools to assist traders in safeguarding their capital and optimizing their trading strategies.
Setting Stop-Loss and Take-Profit Orders:
One of the fundamental aspects of risk management is determining appropriate levels for setting stop-loss and take-profit orders. The Ichimoku Cloud can be a guiding light in this critical process. Here’s how it can help:
- Utilizing Support and Resistance: The cloud’s components, particularly Senkou Span A and Senkou Span B, often act as dynamic support and resistance levels. Traders can use these levels as reference points for placing stop-loss and take-profit orders. For instance, if a long trade is initiated and price is comfortably above the cloud, the cloud’s lower boundary (Senkou Span B) may serve as an ideal level for setting the stop-loss. Conversely, traders may consider placing take-profit orders near the cloud’s upper boundary (Senkou Span A).
- Analyzing Cloud Proximity: The distance between the price and the cloud can provide insights into the trade’s risk-reward ratio. When price is significantly distant from the cloud, it may indicate a potential trend continuation or reversal. Traders should assess the thickness of the cloud and the proximity of price to it to make informed decisions. A thicker cloud often implies stronger support or resistance, influencing the placement of stop-loss and take-profit orders.
By incorporating the Ichimoku Cloud into the process of setting stop-loss and take-profit orders, traders can strike a balance between protecting their capital and maximizing profit potential. This strategic use of the cloud’s support and resistance levels adds a layer of confidence and precision to risk management.
Balancing Risk and Reward with the Ichimoku Cloud:
In addition to setting stop-loss and take-profit levels, traders can utilize the Ichimoku Cloud to evaluate the risk-reward ratio for their trades. This ratio is a fundamental element of risk management and can greatly impact trading outcomes. Here’s how the cloud factors into this assessment:
- Analyzing Cloud Thickness: The thickness of the cloud, which is the space between Senkou Span A and Senkou Span B, can indicate the strength of support or resistance in the market. A thicker cloud suggests robust levels of support or resistance, implying lower risk when trading in the direction of the cloud. Conversely, a thinner cloud may indicate weaker support or resistance, potentially posing higher risk.
- Cloud Proximity: Traders also consider the proximity of the price to the cloud. When price is close to the cloud, it may signal a higher probability of interaction with the cloud’s support or resistance levels. Traders can assess whether the potential reward justifies the associated risk by analyzing this proximity.
By evaluating the thickness of the cloud and the proximity of price to it, traders can make informed decisions about risk-reward ratios. This analysis ensures that each trade aligns with their risk tolerance and profit objectives.
Incorporating the Ichimoku Cloud into risk management practices not only enhances the precision of trading decisions but also helps traders maintain a disciplined approach to protecting their capital. By leveraging the cloud’s support and resistance levels and assessing risk-reward ratios, traders can navigate the forex market with greater confidence and resilience.
Common Mistakes to Avoid
While the Ichimoku Cloud Indicator is a powerful and versatile tool, it’s essential for traders to exercise caution and avoid common mistakes that can undermine their trading success. Here are some pitfalls to be aware of:
- Overcomplication: One of the most prevalent mistakes traders make when using the Ichimoku Cloud is overcomplicating their trading charts. The indicator itself consists of several components that provide valuable information about the market. However, adding too many additional technical indicators alongside the Ichimoku Cloud can lead to information overload, confusion, and contradictory signals. To prevent overcomplication, it’s advisable to keep your trading charts clean and focused. Limit the number of technical indicators you use in conjunction with the Ichimoku Cloud. Choose indicators that complement rather than duplicate the information provided by the cloud. A clutter-free chart allows for better clarity and more confident decision-making.
- Neglecting Fundamental Analysis: While the Ichimoku Cloud is a robust technical analysis tool, it’s essential to recognize its limitations. Traders should avoid the mistake of neglecting fundamental analysis, which considers economic, geopolitical, and macroeconomic factors that can impact currency pairs. To strike a balanced approach to trading, combine technical analysis with fundamental analysis. Keep abreast of economic events, news releases, and geopolitical developments that may affect the forex market. By integrating both forms of analysis, you can make more informed trading decisions and gain a comprehensive understanding of market dynamics.
- Disregarding Risk Management: Even with a powerful tool like the Ichimoku Cloud, traders should not disregard the critical aspect of risk management. Failing to implement effective risk management strategies can lead to significant losses. Always prioritize risk management in your trading plan. Set clear stop-loss and take-profit levels based on the information provided by the Ichimoku Cloud. Establish a risk-reward ratio that aligns with your risk tolerance and trading goals. Avoid risking more capital than you can afford to lose on a single trade. Consistent and disciplined risk management is essential for long-term trading success.
- Lack of Practice and Learning: Another mistake traders make is failing to practice and learn. The Ichimoku Cloud, like any technical tool, requires practice to become proficient. Dedicate time to learning and practicing with the Ichimoku Cloud on demo accounts or with small position sizes. Familiarize yourself with its components, signals, and nuances. Continuously educate yourself about advanced strategies and applications of the indicator. Learning from your experiences and continuously improving your skills will contribute to your success as an Ichimoku Cloud trader.
By avoiding these common mistakes and following best practices, traders can harness the full potential of the Ichimoku Cloud Indicator and enhance their forex trading results.
Ichimoku Cloud vs. Other Technical Indicators
In the world of forex trading, traders have a plethora of technical indicators at their disposal. Each of these tools offers unique insights into market dynamics and can aid in making trading decisions. The Ichimoku Cloud Indicator is a standout among these indicators, but it’s crucial to understand how it compares to other popular technical indicators like moving averages, the Relative Strength Index (RSI), or Moving Average Convergence Divergence (MACD). Let’s explore the distinctions and considerations when choosing among these indicators:
Moving Averages vs. Ichimoku Cloud
- Moving Averages: Moving averages, whether simple or exponential, are widely used to identify trends and potential reversals. They are relatively straightforward and provide a clear representation of price direction.
- Ichimoku Cloud: The Ichimoku Cloud offers a more comprehensive view of the market by incorporating multiple components, including the Kijun Sen, Tenkan Sen, Senkou Span A, and Senkou Span B. It excels at identifying support and resistance levels, trend direction, and potential trend reversals. Consideration: Traders may choose moving averages for simplicity and clarity in identifying trends. However, for a more holistic view of the market and precise entry and exit points, the Ichimoku Cloud can be a superior choice.
Relative Strength Index (RSI) vs. Ichimoku Cloud
- RSI: The Relative Strength Index measures the momentum of price movements and helps identify overbought or oversold conditions. It provides valuable signals for potential trend reversals.
- Ichimoku Cloud: The Ichimoku Cloud encompasses aspects of trend analysis and momentum, making it a versatile tool. It can identify trend strength and potential reversals while also offering support and resistance levels. Traders looking primarily for momentum indications may lean towards RSI. However, those seeking a more holistic approach to market analysis that includes trend direction and support/resistance levels may find the Ichimoku Cloud more beneficial.
Moving Average Convergence Divergence (MACD) vs. Ichimoku Cloud
- MACD: The Moving Average Convergence Divergence is renowned for identifying changes in momentum. It comprises two moving averages and a histogram that visualizes the difference between them.
- Ichimoku Cloud: While MACD is focused on momentum, the Ichimoku Cloud integrates momentum analysis within its broader framework. It can identify trends, confirm momentum shifts, and highlight potential reversals. Traders who prioritize momentum and divergence may prefer MACD. However, those who value a more comprehensive analysis of market conditions may opt for the Ichimoku Cloud.
Adaptability to Market Conditions
It’s essential to recognize that the effectiveness of each indicator can vary based on market conditions. The Ichimoku Cloud’s strength lies in its adaptability. It can serve traders well in different market environments, including trending, ranging, or volatile markets. Its ability to provide dynamic support and resistance levels makes it a valuable tool when compared to single-purpose indicators.
In conclusion, the choice between the Ichimoku Cloud and other technical indicators depends on a trader’s preferences, trading style, and the specific market conditions they are navigating. While each indicator has its merits, the Ichimoku Cloud’s comprehensive nature makes it a compelling choice for traders seeking a versatile tool to enhance their forex trading success. It can complement or even replace multiple single-purpose indicators, streamlining the trading process and providing a more holistic view of the market.
Conclusion
In conclusion, the Ichimoku Cloud Indicator is a versatile tool that can enhance your forex trading strategies. It provides a comprehensive view of market dynamics, aiding in trend identification, entry and exit points, and risk management. However, like any tool, it requires practice and a solid understanding of its components and strategies for successful implementation. By mastering the Ichimoku Cloud, you can elevate your forex trading success and make more informed trading decisions.
Click here to read our latest article on Position Trading Strategies
FAQs
- What is the Ichimoku Cloud Indicator, and how does it work? The Ichimoku Cloud Indicator, also known as Ichimoku Kinko Hyo, is a versatile technical analysis tool used in forex trading. It consists of components like Tenkan Sen, Kijun Sen, Senkou Span A, Senkou Span B, and Chikou Span. It provides insights into trend direction, support/resistance levels, and potential reversals.
- What is the significance of the Tenkan Sen and Kijun Sen? The Tenkan Sen (Conversion Line) and Kijun Sen (Base Line) are key components of the Ichimoku Cloud. They help traders identify short-term and medium-term momentum, respectively. The crossover of these lines generates signals for entry and exit points.
- How does the Senkou Span A and Senkou Span B create the Ichimoku Cloud “kumo”? Senkou Span A and Senkou Span B are combined to create the “kumo” or cloud of the Ichimoku Cloud Indicator. This cloud represents future potential support and resistance levels. The thickness of the cloud offers insights into the strength of these levels.
- What are some basic trading strategies with the Ichimoku Cloud? Basic strategies include Kumo Breakout (trading breakouts from the cloud) and Tenkan-Kijun Crossover (using the crossover of these lines as entry/exit signals). These strategies help traders identify trend directions and potential entry points.
- Are there advanced strategies for using the Ichimoku Cloud? Yes, advanced strategies include Kumo Twist (identifying changes in the cloud’s shape for trend reversals) and Senkou Span Confluence (trading opportunities when Senkou Span A and B are close together). These strategies offer more nuanced approaches to trading with the Ichimoku Cloud.
- How does the Ichimoku Cloud help in risk management? The Ichimoku Cloud aids in risk management by providing support and resistance levels for setting stop-loss and take-profit orders. Traders can analyze the cloud’s thickness and price proximity to assess the risk-reward ratio for each trade.
- What common mistakes should I avoid when using the Ichimoku Cloud? Common mistakes include overcomplicating charts with too many indicators, neglecting fundamental analysis, and lacking discipline in risk management. It’s essential to keep your trading approach clear and well-balanced.
- Can I use the Ichimoku Cloud in conjunction with other technical indicators? Yes, the Ichimoku Cloud can be used alongside other indicators, but it’s crucial to avoid overcomplicating your charts. Choose complementary indicators that align with your trading strategy.
- Is the Ichimoku Cloud suitable for both beginners and experienced traders? Yes, the Ichimoku Cloud is versatile and can benefit traders of all levels. Beginners can use basic strategies, while experienced traders can explore advanced techniques to enhance their trading success.
- How can I learn to use the Ichimoku Cloud effectively? To master the Ichimoku Cloud, start by learning its components and basic strategies. Practice on demo accounts, study real-world examples, and continually educate yourself about its applications. Consistent practice and learning are key to proficiency.
Click here to learn more about the Ichimoku Cloud Indicator